NAR: Pending Home Sales Fall 1.9% in June

Pending home sales declined marginally in June after recording a notable gain in May, the National Association of Realtors® reported. Contract activity was split in the four major U.S. regions from both a year-over-year and month-over-month perspective. The Northeast recorded the only yearly gains in June.
Key Highlights
– Pending home sales decreased 1.9% in June from the prior month and from one year ago.
– Compared to the month before, contract signings rose in the Northeast and Midwest but fell in the South and West.
– Compared to one year ago, only the Northeast region saw an increase in contract signings.
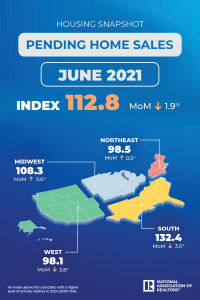
The Pending Home Sales Index (“PHSI”),* www.nar.realtor/pending-home-sales, a forward-looking indicator of home sales based on contract signings, fell 1.9% to 112.8 in June. Year-over-year, signings also slipped 1.9%. An index of 100 is equal to the level of contract activity in 2001.
“Pending sales have seesawed since January, indicating a turning point for the market,” said Lawrence Yun, NAR’s chief economist. “Buyers are still interested and want to own a home, but record-high home prices are causing some to retreat.
“The moderate slowdown in sales is largely due to the huge spike in home prices,” Yun continued. “The Midwest region offers the most affordable costs for a home and hence that region has seen better sales activity compared to other areas in recent months.”
June Pending Home Sales Regional Breakdown
The Northeast PHSI increased 0.5% to 98.5 in June, an 8.7% rise from a year ago. In the Midwest, the index grew 0.6% to 108.3 last month, down 2.4% from June 2020.
Pending home sales transactions in the South fell 3.0% to an index of 132.4 in June, down 4.7% from June 2020. The index in the West decreased 3.8% in June to 98.1, down 2.6% from a year prior.
Yun forecasts that mortgage rates will start to inch up toward the end of the year. “This rise will soften demand and cool price appreciation.”
“In just the last year, increasing home prices have translated into a substantial wealth gain of $45,000 for a typical homeowner,” he said. “These gains are expected to moderate to around $10,000 to $20,000 over the next year.”
According to Yun, the 30-year fixed mortgage rate is likely to increase to 3.3% by the end of the year, and will average 3.6% in 2022. With the slight uptick in mortgage rates, he expects existing-home sales to marginally decline to 5.99 million (6 million in 2021). Yun added that, with demand easing and housing starts improving to 1.65 million (1.565 in 2021), existing-home sales prices are expected to increase at a slower pace of 4.4% in 2022 (14.1% in 2021) to a median of $353,500.
The National Association of Realtors® is America’s largest trade association, representing more than 1.4 million members involved in all aspects of the residential and commercial real estate industries.
# # #
*The Pending Home Sales Index is a leading indicator for the housing sector, based on pending sales of existing homes. A sale is listed as pending when the contract has been signed but the transaction has not closed, though the sale usually is finalized within one or two months of signing. Pending contracts are good early indicators of upcoming sales closings. However, the amount of time between pending contracts and completed sales are not identical for all home sales. Variations in the length of the process from pending contract to closed sale can be caused by issues such as buyer difficulties with obtaining mortgage financing, home inspection problems, or appraisal issues. The index is based on a large national sample, typically representing about 20% of transactions for existing-home sales. In developing the model for the index, it was demonstrated that the level of monthly sales-contract activity parallels the level of closed existing-home sales in the following two months. An index of 100 is equal to the average level of contract activity during 2001, which was the first year to be examined. By coincidence, the volume of existing-home sales in 2001 fell within the range of 5.0 to 5.5 million, which is considered normal for the current U.S. population.
NOTE: Existing-Home Sales for July will be reported August 23. The next Pending Home Sales Index will be August 30; all release times are 10:00 a.m. ET.
Source: National Association of Realtors


