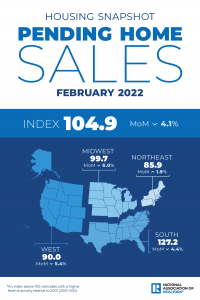
NAR: Pending Home Sales Dwindle 4.1% in February

Pending home sales slipped in February, marking four consecutive months of transaction decreases, according to the National Association of Realtors®. Three of the four major U.S. regions saw contract signings fall month-over-month, with the Northeast being the only area that reported an increase. All four regions registered a decline in year-over-year contract activity.
Key Highlights
- Contract signings fell for the fourth consecutive month, down 4.1% in February from January.
- Month-over-month, contract signings were down across all regions, except the Northeast.
- Contract signings fell from the previous year for the ninth consecutive month, falling by 5.4%, with pending sales down across all regions.
The Pending Home Sales Index (“PHSI”),* www.nar.realtor/pending-home-sales, a forward-looking indicator of home sales based on contract signings, waned 4.1% to 104.9 in February. Year-over-year, transactions dropped 5.4%. An index of 100 is equal to the level of contract activity in 2001.
“Pending transactions diminished in February mainly due to the low number of homes for sale,” said Lawrence Yun, NAR’s chief economist. “Buyer demand is still intense, but it’s as simple as ‘one cannot buy what is not for sale.'”
Along with climbing home prices, Yun added that now buyers must grapple with rising mortgage rates and noted that shoppers will likely want to lock in before rates increase further.
“It is still an extremely competitive market, but fast-changing conditions regarding affordability are ahead,” he said. “Consequently, home sellers cannot simply bump up prices in the upcoming months, but need to assess the changing market conditions to attract buyers.”
As of February 2022, higher mortgage rates and sustained price appreciation has led to a year-over-year increase of 28% in mortgage payments.
“The surge in home prices combined with rising mortgage rates can easily translate to another $200 to $300 in mortgage payments per month, which is a major strain for many families already on tight budgets.”
Yun forecasts mortgage rates to be about 4.5% to 5% for the remainder of the year and expects about a 7% reduction in home sales in 2022 compared to 2021.
“Home prices themselves are still on solid ground,” he added. “They may rise around 5% by year’s end and we should see much softer gains in the second half of the year.”
Realtor.com®’s Hottest Housing Markets(link is external) data in February showed that of the largest 40 metros, the most improved markets over the past year were Orlando-Kissimmee-Sanford, Fla.; Miami-Ft. Lauderdale, Fla.; Nashville-Davidson, Tenn.; Indianapolis, Ind.; and San Diego-Carlsbad, Calif.
February Pending Home Sales Regional Breakdown
Month-over-month, the Northeast PHSI rose 1.9% to 85.0 in February, a 9.2% drop from a year ago. In the Midwest, the index decreased 6.0% to 99.7 last month, down 5.2% from February 2021.
Pending home sales transactions in the South declined 4.4% to an index of 127.2 in February, down 4.3% from February 2021. The index in the West slid 5.4% in February to 90.0, down 5.3% from a year prior.
The National Association of Realtors® is America’s largest trade association, representing more than 1.5 million members involved in all aspects of the residential and commercial real estate industries.
# # #
*The Pending Home Sales Index is a leading indicator for the housing sector, based on pending sales of existing homes. A sale is listed as pending when the contract has been signed but the transaction has not closed, though the sale usually is finalized within one or two months of signing. Pending contracts are good early indicators of upcoming sales closings. However, the amount of time between pending contracts and completed sales is not identical for all home sales. Variations in the length of the process from pending contract to closed sale can be caused by issues such as buyer difficulties with obtaining mortgage financing, home inspection problems, or appraisal issues. The index is based on a sample that covers about 40% of multiple listing service data each month. In developing the model for the index, it was demonstrated that the level of monthly sales-contract activity parallels the level of closed existing-home sales in the following two months. An index of 100 is equal to the average level of contract activity during 2001, which was the first year to be examined. By coincidence, the volume of existing-home sales in 2001 fell within the range of 5.0 to 5.5 million, which is considered normal for the current U.S. population.
NOTE: Existing-Home Sales for March will be reported April 20. The next Pending Home Sales Index will be April 27; all release times are 10:00 a.m. ET.
Contact:
Quintin Simmons – Media Contact – (202)383-1178
Source: National Association of Realtors


