CoreLogic: Monthly US Home Price Gains Dip Below Seasonal Average in April

U.S. year-over-year single-family home price appreciation was 5.3% in April, the same as in March
All states posted annual appreciation in March, led by New Hampshire (12%), New Jersey (11%) and South Dakota (10.8%)
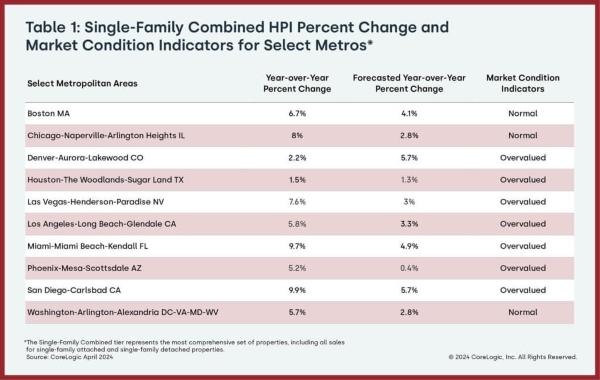
Of the 10 tracked major U.S. metro areas, San Diego (9.9%) overtook Miami (9.7%) for the top spot
CoreLogic®, a leading global property information, analytics and data-enabled solutions provider, released the CoreLogic Home Price Index (HPI™) and HPI Forecast™ for April 2024.
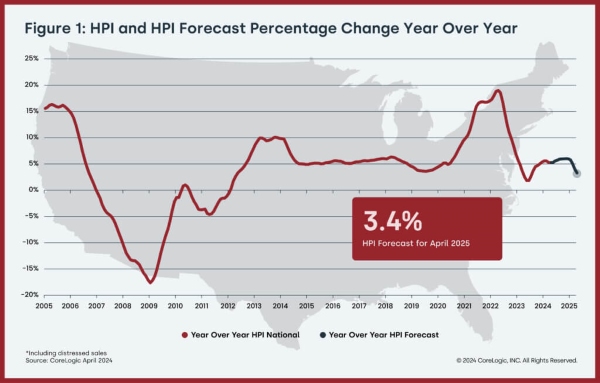
Annual U.S. home price appreciation remained above 5% in April, with three states posting double-digit gains. By next spring, national price gains are projected to slow to 3.4%, with only a few states putting up increases of higher than 6%. This slow cooling reflects not only the increasing number of homes on the market in some parts of the country, but also elevated, 30-year, fixed-rate mortgages, which remain around 7%, a major factor influencing America’s continuing housing affordability challenges.
“Home price growth continues to slow, as a comparison with a strong 2023 spring is still impacting year-over-year differences,” said Dr. Selma Hepp, chief economist for CoreLogic. “Nevertheless, the April uptick in mortgage rates to this year’s high has cooled some of the typical spring homebuyer demand, which pulled monthly gains of 1.1% below the March-to-April average.”
“The home price slowing also highlights buyers’ increased sensitivity to rising interest rates, as well as the anticipation that presumed lower rates down the road will help ease the affordability crunch,” Hepp continued. “Also, the price cooling is more pronounced in markets where there has been an influx of inventory and/or new construction, as well as those where additional homeownership costs (such as insurance, taxes and HOA fees) have risen relatively faster.”
Top Takeaways:
- U.S. single-family home prices (including distressed sales) increased by 5.3% year over year in April 2024 compared with April 2023. On a month-over-month basis, home prices increased by 1.1% compared with March 2024.
- In April, the annual appreciation of detached properties (5.7%) was 2 percentage points higher than that of attached properties (3.7%).
- CoreLogic’s forecast shows annual U.S. home price gains relaxing to 3.4% in April 2025.
- San Diego posted the highest year-over-year home price increase of the country’s 10 highlighted metro areas in April, at 9.9%. Miami saw the next-highest gain at 9.7%.
- Among states, New Hampshire ranked first for annual appreciation in April (up by 12%), followed by New Jersey (up by 11%) and South Dakota (up by 10.8%). No state recorded year-over-year home price losses.
The next CoreLogic HPI press release, featuring May 2024 data, is scheduled to be issued on July 2, 2024, at 8 a.m. EST.
Methodology
The CoreLogic HPI™ is built on industry-leading public record, servicing and securities real-estate databases and incorporates more than 45 years of repeat-sales transactions for analyzing home price trends. Generally released on the first Tuesday of each month with an average five-week lag, the CoreLogic HPI is designed to provide an early indication of home price trends by market segment and for the Single-Family Combined tier, representing the most comprehensive set of properties, including all sales for single-family attached and single-family detached properties. The indices are fully revised with each release and employ techniques to signal turning points sooner. The CoreLogic HPI provides measures for multiple market segments, referred to as tiers, based on property type, price, time between sales, loan type (conforming vs. non-conforming) and distressed sales. Broad national coverage is available from the national level down to ZIP Code, including non-disclosure states.
CoreLogic HPI Forecasts™ are based on a two-stage, error-correction econometric model that combines the equilibrium home price—as a function of real disposable income per capita—with short-run fluctuations caused by market momentum, mean-reversion, and exogenous economic shocks like changes in the unemployment rate. With a 30-year forecast horizon, CoreLogic HPI Forecasts project CoreLogic HPI levels for two tiers — Single-Family Combined (both attached and detached) and Single-Family Combined Excluding Distressed Sales. As a companion to the CoreLogic HPI Forecasts, Stress-Testing Scenarios align with Comprehensive Capital Analysis and Review (CCAR) national scenarios to project five years of home prices under baseline, adverse and severely adverse scenarios at state, metropolitan areas and ZIP Code levels. The forecast accuracy represents a 95% statistical confidence interval with a +/- 2% margin of error for the index.
About CoreLogic
CoreLogic is a leading provider of property insights and innovative solutions, working to transform the property industry by putting people first. Using its network, scale, connectivity and technology, CoreLogic delivers faster, smarter, more human-centered experiences that build better relationships, strengthen businesses and ultimately create a more resilient society. For more information, please visit www.corelogic.com.
CORELOGIC, the CoreLogic logo, CoreLogic HPI and CoreLogic HPI Forecast are trademarks of CoreLogic, Inc. and/or its subsidiaries. All other trademarks are the property of their respective owners.
Contact:
Robin Wachner – Media Contact – newsmedia@corelogic.com
Source: CoreLogic, Inc.
The Value of Membership

As the leading provider of in-depth business and credit information on the domestic lumber & forest products industry, a membership with Blue Book Services gives you access to:
- Ratings & Business Reports
- Dynamic Search Tools
- Real-Time Data