NAR: Pending Home Sales Bounce Back 8.0% in May

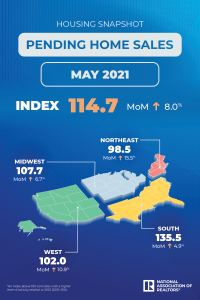
Pending home sales rebounded strongly in May, reaching the highest reading ever for the month of May since 2005, according to the National Association of Realtors®. All four U.S. regions registered both month-over-month increases and year-over-year gains for pending home sales contract transactions for the month of May.
Key Highlights
– Pending home sales rose 8% in May from the prior month and 13.1% from one year ago.
– The May 2021 Pending Home Sales Index of 114.7 is the highest reading for May since 2005.
– Contract signings rose in all regions in May compared to the prior month and one year ago.
The Pending Home Sales Index (“PHSI”),* www.nar.realtor/pending-home-sales, a forward-looking indicator of home sales based on contract signings, rose 8.0% to 114.7 in May. Year-over-year, signings increased 13.1%. An index of 100 is equal to the level of contract activity in 2001.
“May’s strong increase in transactions – following April’s decline, as well as a sudden erosion in home affordability – was indeed a surprise,” said Lawrence Yun, NAR’s chief economist. “The housing market is attracting buyers due to the decline in mortgage rates, which fell below 3%, and from an uptick in listings.”
Although there has been a series of obstacles over the last year, including an unprecedented pandemic, record-high prices and all-time low inventory, buyers are still lining up at a feverish pace, according to Yun.
“While these hurdles have contributed to pricing out some would-be buyers, the record-high aggregate wealth in the country from the elevated stock market and rising home prices are evidently providing funds for home purchases,” Yun said. “More market listings will appear in the second half of 2021, in part from the winding down of the federal mortgage forbearance program and from more home building.
“Home price growth will steadily moderate with increased supply, but a broad and prolonged decline in prices is unlikely,” Yun continued. “However, if a reduction occurs in some markets, homebuyers will view the lower home price as a second-chance opportunity to get into the market after being outbid in previous multiple-bid market conditions.”
Realtor.com®’s Hottest Housing Markets(link is external) data revealed that out of the largest 40 metros, the most improved metros over the past year, as of June 29, were Tampa-St. Petersburg-Clearwater, Fla.; Detroit-Warren-Dearborn, Mich.; Nashville-Davidson-Murfreesboro-Franklin, Tenn.; Riverside-San Bernardino-Ontario, Calif.; and Jacksonville, Fla.
May Pending Home Sales Regional Breakdown
The Northeast PHSI increased 15.5% to 98.5 in May, a 54.6% climb from a year ago. In the Midwest, the index grew 6.7% to 107.7 last month, up 7.8% from May 2020.
Pending home sales transactions in the South rose 4.9% to an index of 135.5 in May, up 6.1% from May 2020. The index in the West increased 10.9% in May to 102.0, up 12.5% from a year prior.
The National Association of Realtors® is America’s largest trade association, representing more than 1.4 million members involved in all aspects of the residential and commercial real estate industries.
# # #
*The Pending Home Sales Index is a leading indicator for the housing sector, based on pending sales of existing homes. A sale is listed as pending when the contract has been signed but the transaction has not closed, though the sale usually is finalized within one or two months of signing. Pending contracts are good early indicators of upcoming sales closings. However, the amount of time between pending contracts and completed sales are not identical for all home sales. Variations in the length of the process from pending contract to closed sale can be caused by issues such as buyer difficulties with obtaining mortgage financing, home inspection problems, or appraisal issues. The index is based on a large national sample, typically representing about 20% of transactions for existing-home sales. In developing the model for the index, it was demonstrated that the level of monthly sales-contract activity parallels the level of closed existing-home sales in the following two months. An index of 100 is equal to the average level of contract activity during 2001, which was the first year to be examined. By coincidence, the volume of existing-home sales in 2001 fell within the range of 5.0 to 5.5 million, which is considered normal for the current U.S. population.
NOTE: Existing-Home Sales for June will be reported July 22. The next Pending Home Sales Index will be July 29; all release times are 10:00 a.m. ET.
Source: National Association of Realtors


